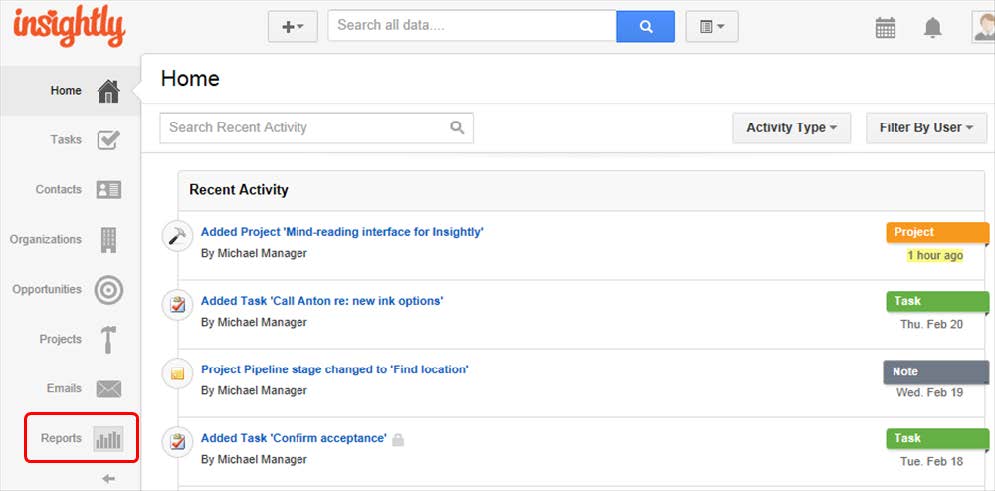
Insightly’s reporting functionality includes nine reports centered around opportunities and one around completed activities (tasks and events). If the current reports don’t meet a specific need, you can always export records to slice and dice the data to your liking. The reporting section can be accessed via the bar graph icon in the left navigation bar.
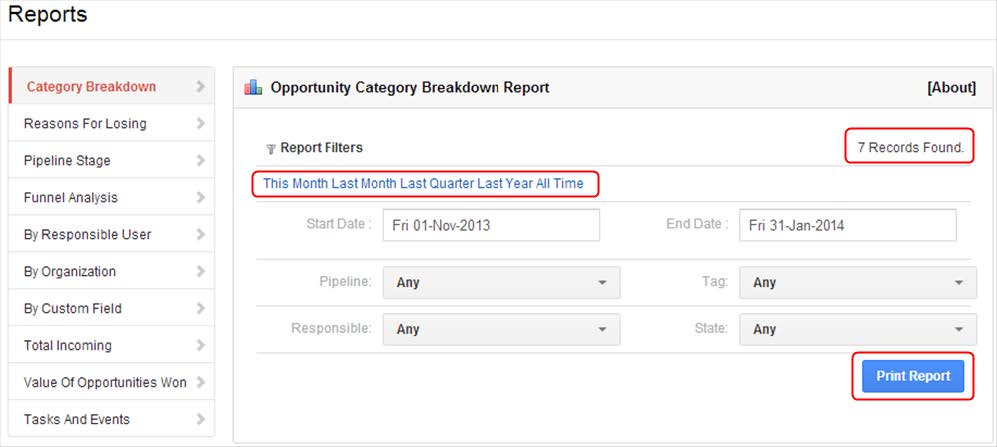
All of the reports have a few handy links at the top to filter records by commonly used date ranges. When you run a report, Insightly displays the number of records found in the header, and a handy button to format the report for printing.
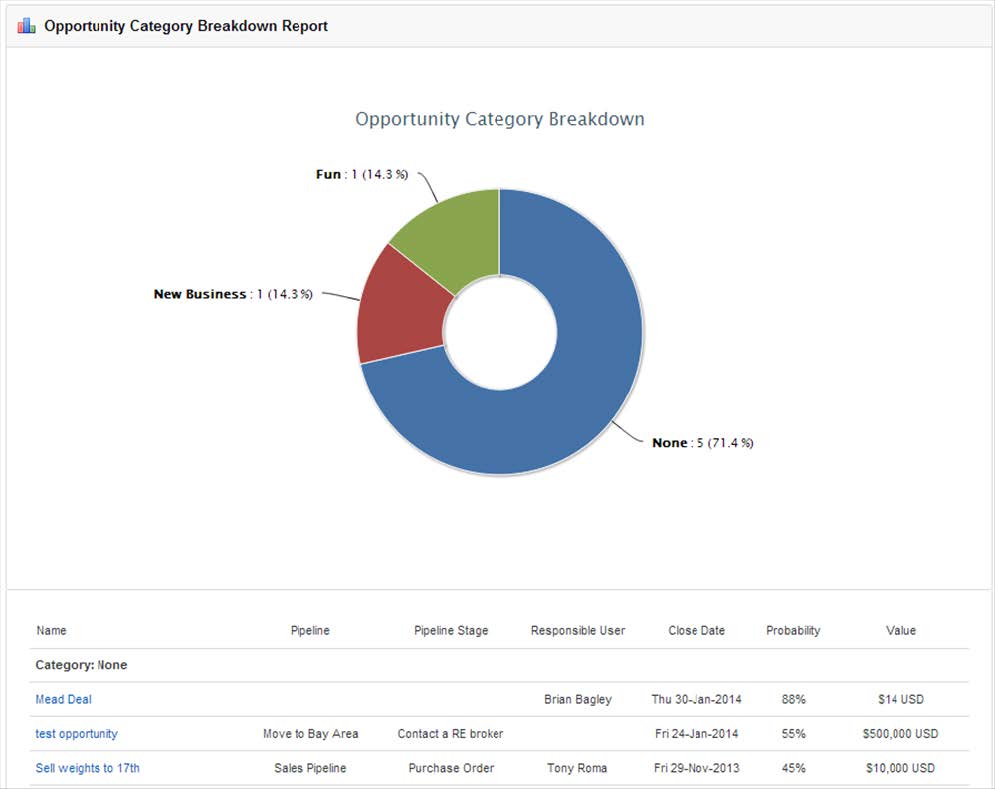
Opportunity Category Breakdown Report
How many opportunities do you have in each of your opportunity categories? This report graphs the number of opportunities you have for each of your opportunity categories in a donut chart. You can filter your opportunities by forecast close date, pipeline, responsible user, currency, tag or opportunity state. With this and most of the reports, the tabular data that makes up the report is displayed below the graph.
Reasons for Losing Opportunities Report
What are the main reasons you lose out on new business? This report will graph the number of opportunities you lost and the reasons why you lost them in a donut graph. When you lose an opportunity in Insightly, you have the option to give a reason (which can be configured under Settings > Opportunity State Reasons). This report will graph all of the opportunities you lost for a given set of criteria, so you can easily see the main reasons that you’re losing out on new business and how you can improve in the future.
Opportunity Pipeline Stage Distribution Report
At what pipeline stage are all the opportunities you have open and set to close in the next quarter? This report graphs the number of opportunities in each stage of an opportunity pipeline, filtered by Forecast Close Date.
It’s a great way to tell if most of your opportunities are at early stages in a pipeline or if you have progressed them through to later stages and they are closer to closing. You can filter by pipeline, forecast close date, or by responsible user, category, currency, tag or opportunity state.
Opportunity Funnel Analysis
How many opportunities are currently in each stage of a pipeline? This report provides a snapshot of your open opportunities, broken down by the pipeline stages you have created.
Opportunities by Responsible User Report
Which of your sales people closed the most opportunities in the last quarter? Which sales people generated the most revenue last year? This report shows you which users generated the most new opportunities, or the most revenue in a given time period. You can filter by the number of wins, or by the total revenue of opportunities won in a given currency. It’s a great way to see who is your most productive sales person, or who contributed most to the bottom line in the last quarter.
Opportunities by Organization Report
Which client organizations contribute the most to your revenue? Which of your clients do you have the worst opportunity win record against? This report will show you a breakdown of which organizations make up the opportunity volume generated by your sales team in a given time period. You can filter by pipeline, current opportunity state, tag, category or even currency.
Opportunities by Custom Field Report
This report will provide a breakdown of the number of opportunities with each value set for a custom field. If you use custom fields for opportunities to segment your opportunity list then this report can be useful in graphing the breakdown of values for those custom fields.
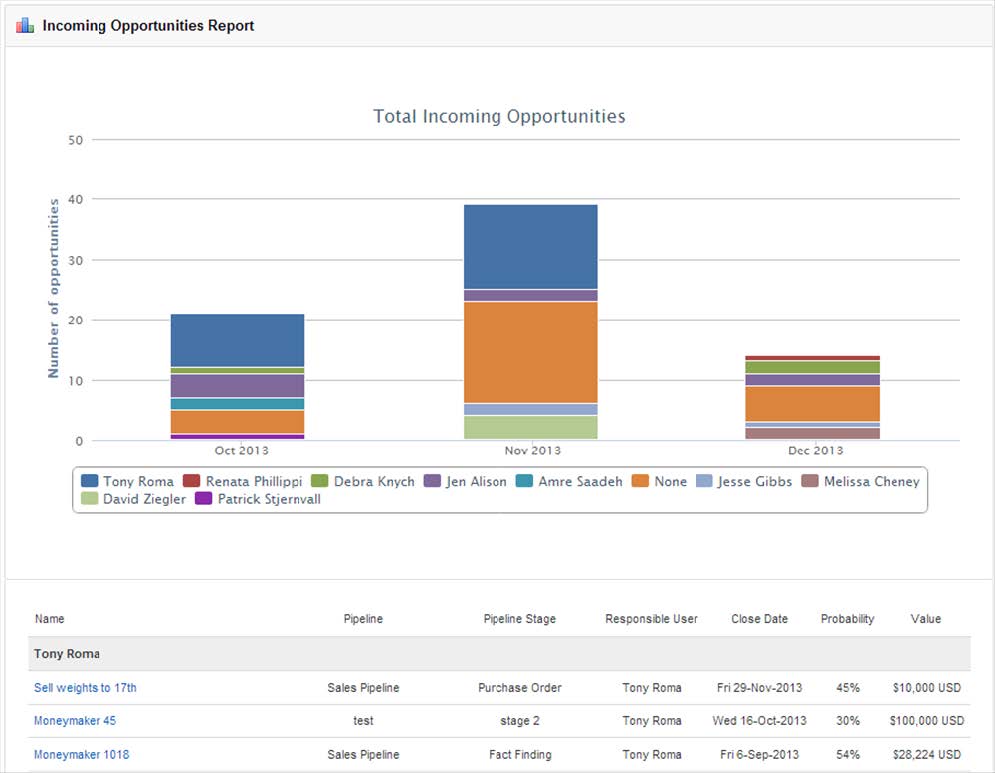
Total Incoming Opportunities Report
How many opportunities did each of your sales people create by month last year? This report shows you how many new opportunities each of your sales people created in a given time period, so it’s great for determining deal flow from each of your sales people, and who is the most productive sales person you might have. The ‘Value of Opportunities Won’ report is the compliment to this report and graphs by revenue rather than deal volume.
Value of Opportunities Won Report
Which of your sales people was the most successful in January and February in revenue generation? This report shows you the total revenue value of opportunities won in a given time period, broken down by responsible user. It’s great for determining which of your sales people contributed the most to top line revenue in a given time period. You can identify the most and least productive sales people in your organization.
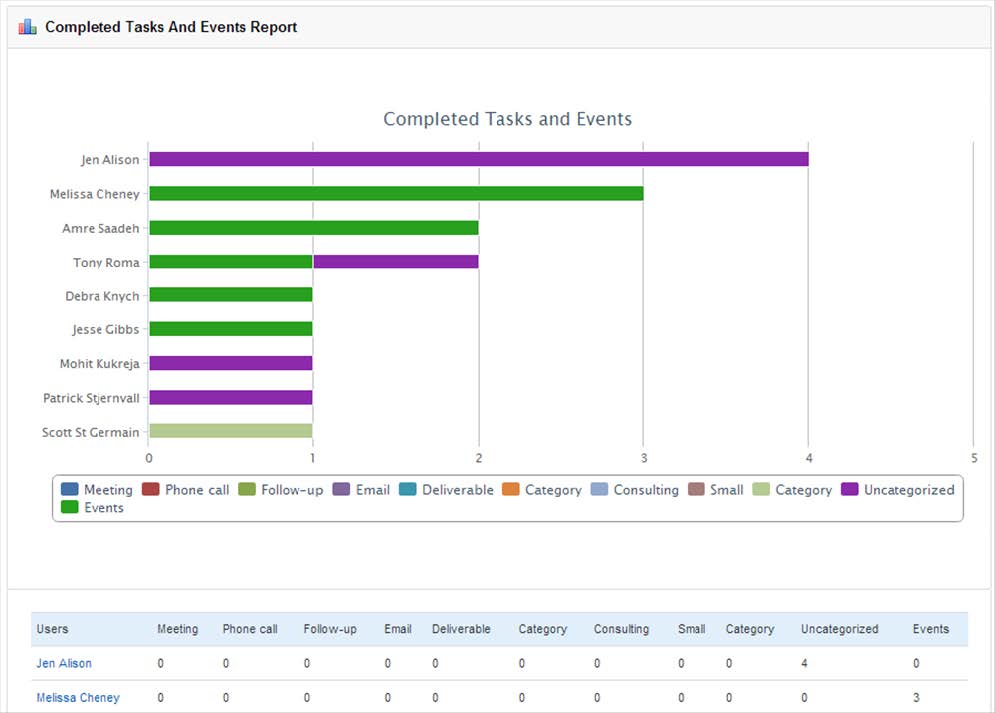
Completed Tasks and Events Report
Which of your users completed the most tasks assigned to them the last quarter? Which organizations did you have the most phone calls with last year? Which opportunities created the most work for you in follow-up calls and emails last month? Did you complete more tasks in November or December last year? This is one of the most powerful reports in the arsenal, and graphs the number of tasks completed, and meetings and appointments scheduled in a time period – broken down by either responsible user, linked organization, opportunity, project, or in total by month over a time period. The key filter here is the ‘Type’ filter and gives you some great insight into which projects, opportunities, or organizations have required the most work to get over the line.
“Insufficient data” messages on reports
There are various reasons why your opportunity reports may show incomplete or no data. A currency type – USD, AUD, EUR, etc., is required for an opportunity to appear on any report. You do not have to have a value amount unless the report requires values. Depending on the report you select, you may also need data in the following opportunity fields in order for them to appear on selected reports.
- A forecast close date.
- An opportunity value.
- The probability of winning.
Also, make sure that you’ve chosen the correct time frame This Month, Last Month, Last Quarter, Last Year, All Time with different dates in mind. Some reports use the Forecast Close Date field, while others use the date the opportunity was created or the date it was actually marked closed by changing the status to Won or Lost. If you’ve reviewed all these parameters and the items are still not showing up in your report, please send us an example of an item you think should be included in your report. Also, let us know which report you are having problems with.